Research Roundup Webinar #2: Private School Choice and Character

School choice is more than just better test scores. It enhances the character of students and families.

This often overlooked fact is evident in the study Private School Choice and Character: More Evidence from Milwaukee by Corey DeAngelis, Director of School Choice at Reason Foundation, and Dr. Patrick Wolf, Distinguished Professor of Education Policy and 21st Century Endowed Chair in School Choice in the Department of Education Reform at the University of Arkansas College of Education and Health Professions.

DeAngelis and Wolf joined us for a webinar highlighting their findings about school choice’s impact on student character. These included:

  • 53 percent in drug convictions
  • 86 percent reduction of property damage convictions
  • 38 percent reduction in paternity suits

These findings show private school choice enhances the overall life of students, allowing them advantages they would not have otherwise had. DeAngelis said school choice “strengthens the family unit.” Wolf agreed and said, this provides societal benefits of “economically and socially responsible citizens.”

In his closing remarks, DeAngelis reminded everyone that “school choice is criminal justice reform.”

Other resources:


Research Roundup #1: The Economic Impacts of Learning Losses with Dr. Eric Hanushek

Dr. Eric Hanushek joined us Tuesday, January 23 to present on his study The Economic Impacts of Learning Losses due to COVID-19. The numbers are stark and permanent if nothing is done to fully catch students up to 2021 and not just settle with 2020 levels.

Dr. Hanushek estimates that as of February 2021, learning losses due to COVID-19:

  • Will cost an average student six to nine percent of their lifetime earnings
  • Will lower the GDP three to four percent or more than $27 trillion over the rest of the century. He stated politicians and education leaders “can’t ignore the economic losses.”
  • Will be even worse for disadvantaged students, who will experience 50 percent greater learning loss than the average student. This means a nine to more than 13 percent lifetime income loss.

Dr. Hanushek also delved into potential solutions to helping with learning loss. This included individualizing instruction to meet the needs of the students, lengthening instruction time, reviewing and modifying collective bargaining agreements, and more effectively utilizing teachers and personnel. He said, “This generation has been harmed, seriously harmed.” He reiterated that we need to start planning for what education will look like in the future since it should not look the same as it did.

Dr. Eric HanushekDr. Eric Hanushek is the Paul and Jean Hanna Senior Fellow at the Hoover Institution of Stanford University. He is a recognized leader in the economic analysis of education issues, and his research has had broad influence on education policy in both developed and developing countries. He is the author of numerous widely-cited studies on the effects of class size reduction, school accountability, teacher effectiveness, and other topics. He was the first to research teacher effectiveness by measuring students’ learning gains, which formed the conceptual basis for using value-added measures to evaluate teachers and schools, now a widely adopted practice. His recent book, The Knowledge Capital of Nations: Education and the Economics of Growth summarizes his research establishing the close links between countries’ long-term rates of economic growth and the skill levels of their populations. His current research analyzes why some countries’ school systems consistently perform better than others. He has authored or edited twenty-four books along with over 250 articles. He is a Distinguished Graduate of the United States Air Force Academy and completed his Ph.D. in economics at the Massachusetts Institute of Technology.

How a Pandemic Could Fundamentally Alter the Education System

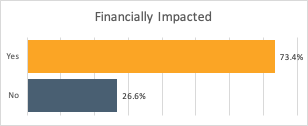
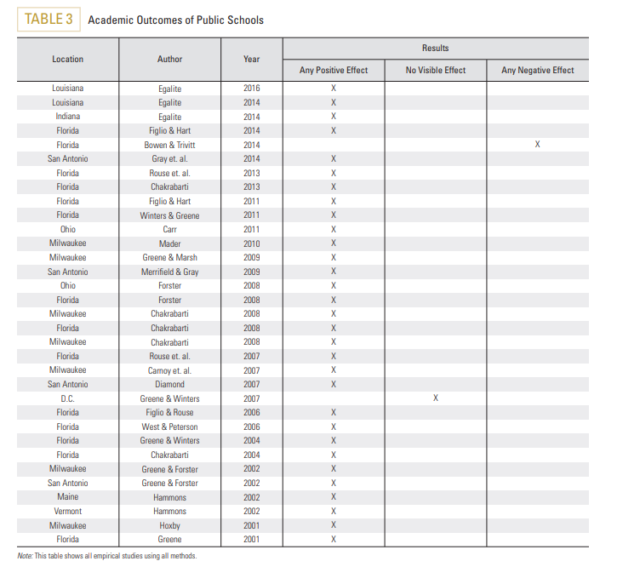
As COVID-19 ramped up, schools were closed, parents were being laid off or having hours greatly reduced. This created turmoil within the education system and even more disruption for student and parent routines. The education system was wholly unprepared for this new reality.

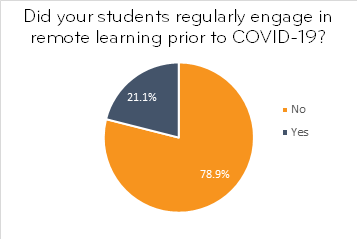
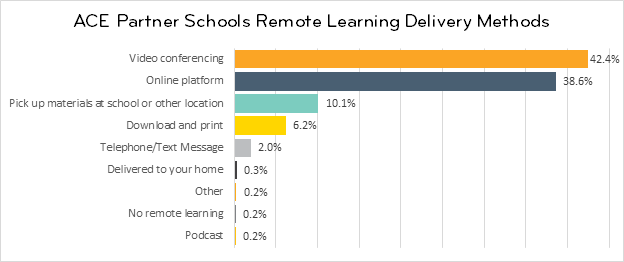
Schools were forced to switch to remote learning in a matter of days. Survey data show schools of different types addressed remote learning and how they served student populations differently.

Remote Learning

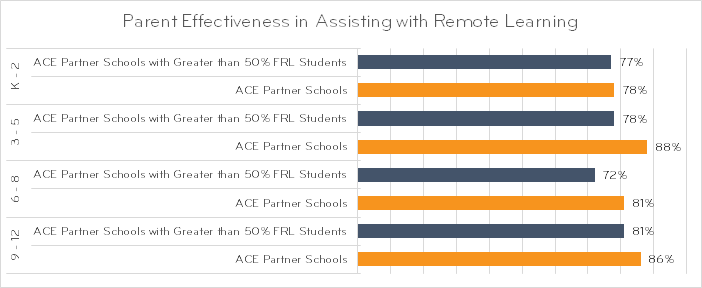
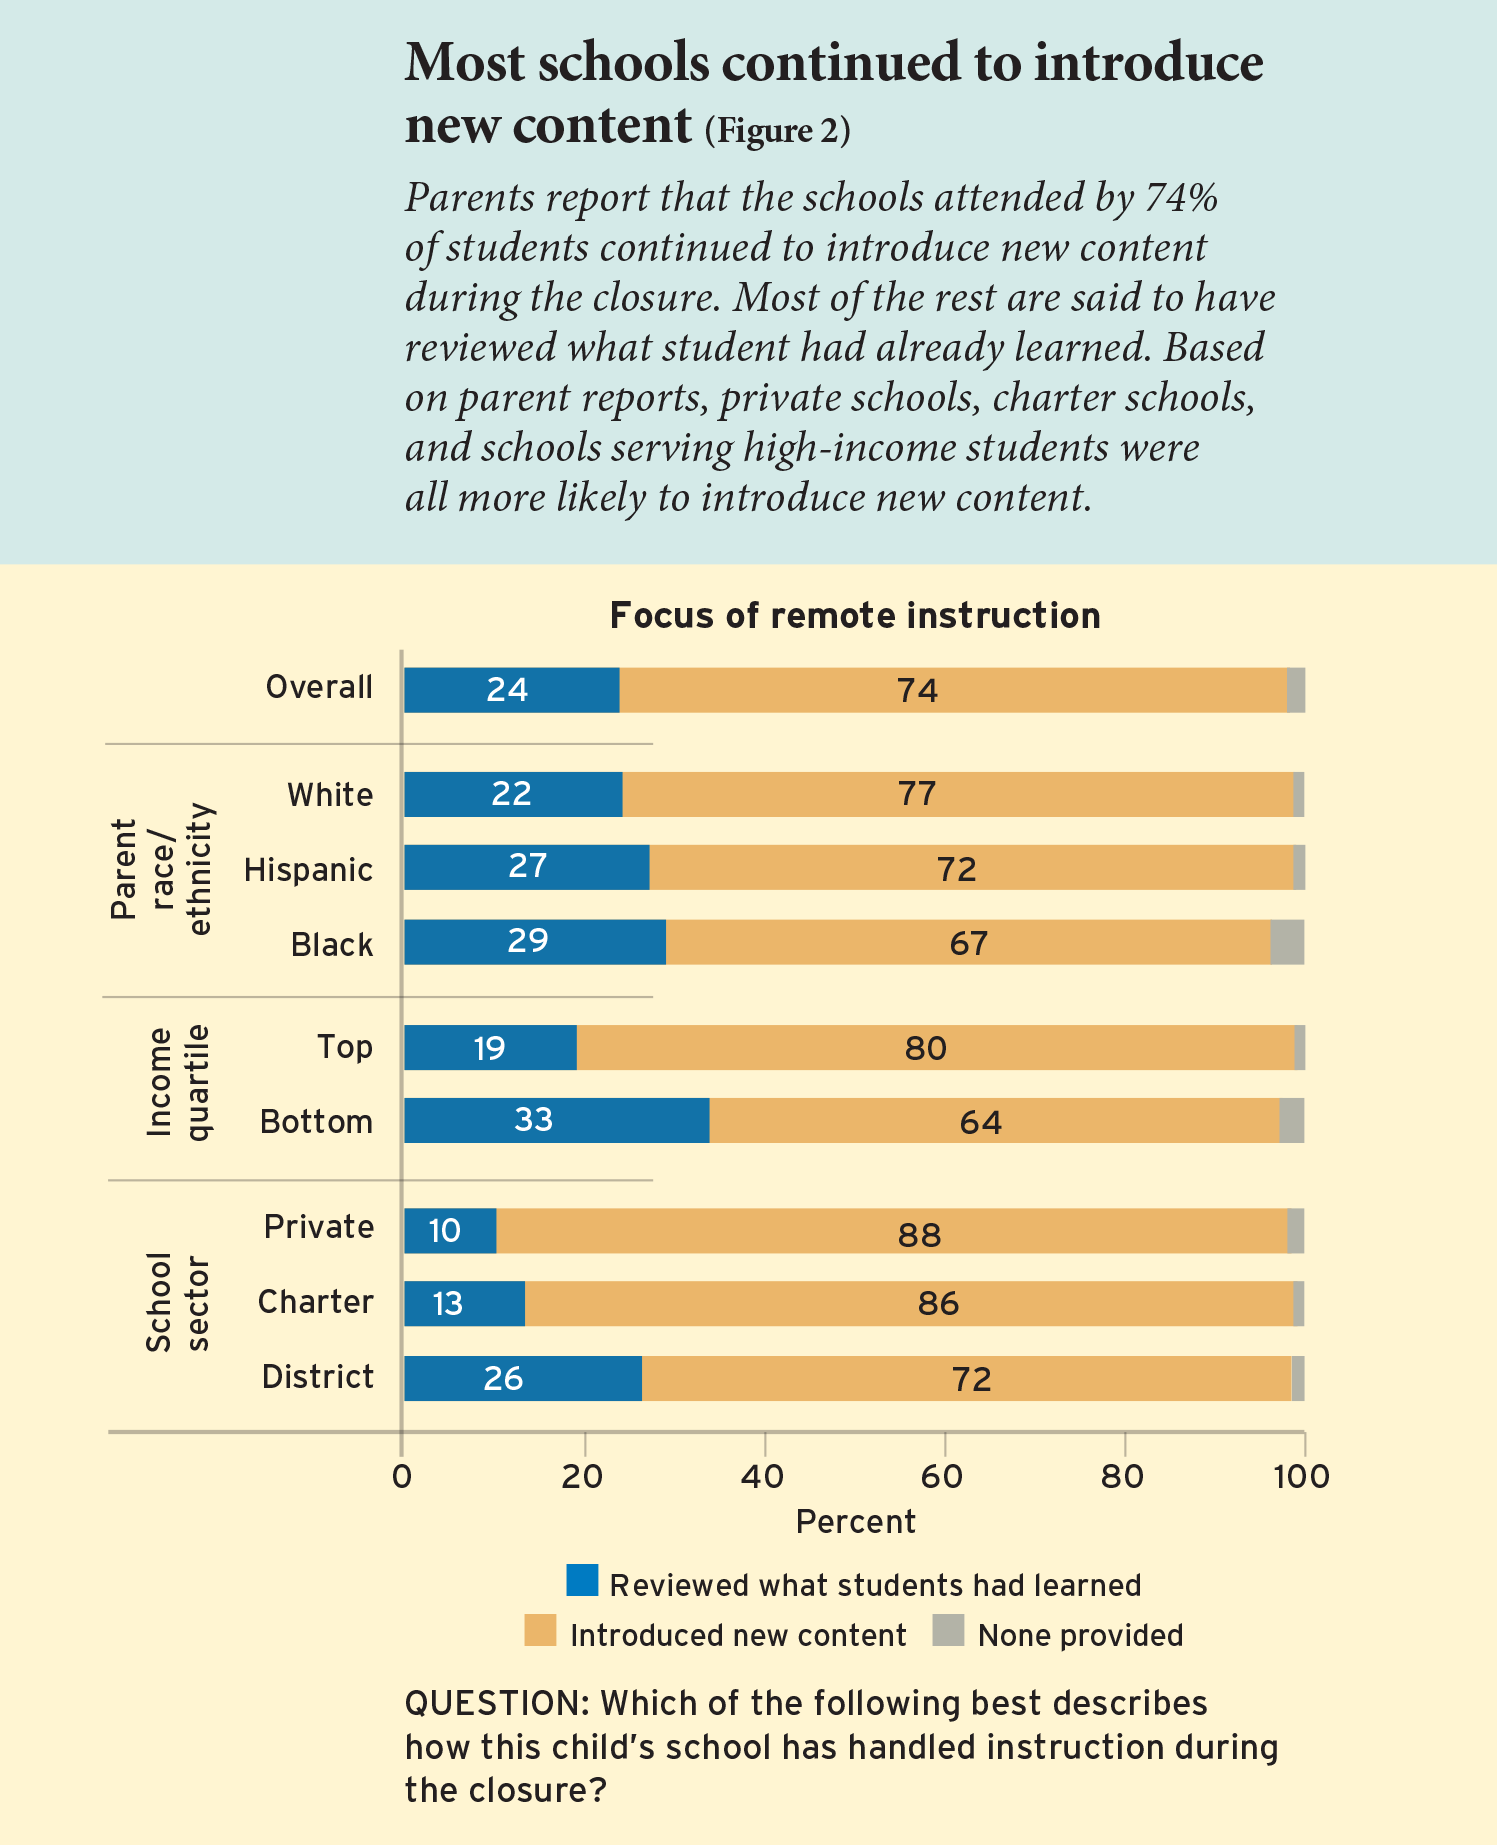
Many feared remote learning would focus on just reviewing past material instead of being more rigorous with the continued introduction of new content. Traditional public-school parents spent 72 percent of their time introducing new content and 26 percent reviewing past content. Charter school parents however, introduced new content 86 percent of the time and 13 percent reviewing past content. Private school parents spent 88 percent of their time on new content and only 10 percent on past content.

When you review this data by income, there is a dramatic gap between the top quartile and bottom quartile. The bottom quartile received new content 64 percent of the time as compared to 80 percent for the top quartile. The bottom quartile spent 14 percentage points more time reviewing past content.

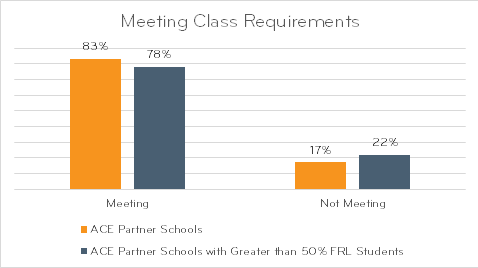
Instruction Activity

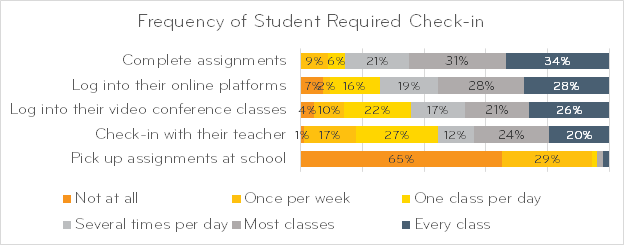
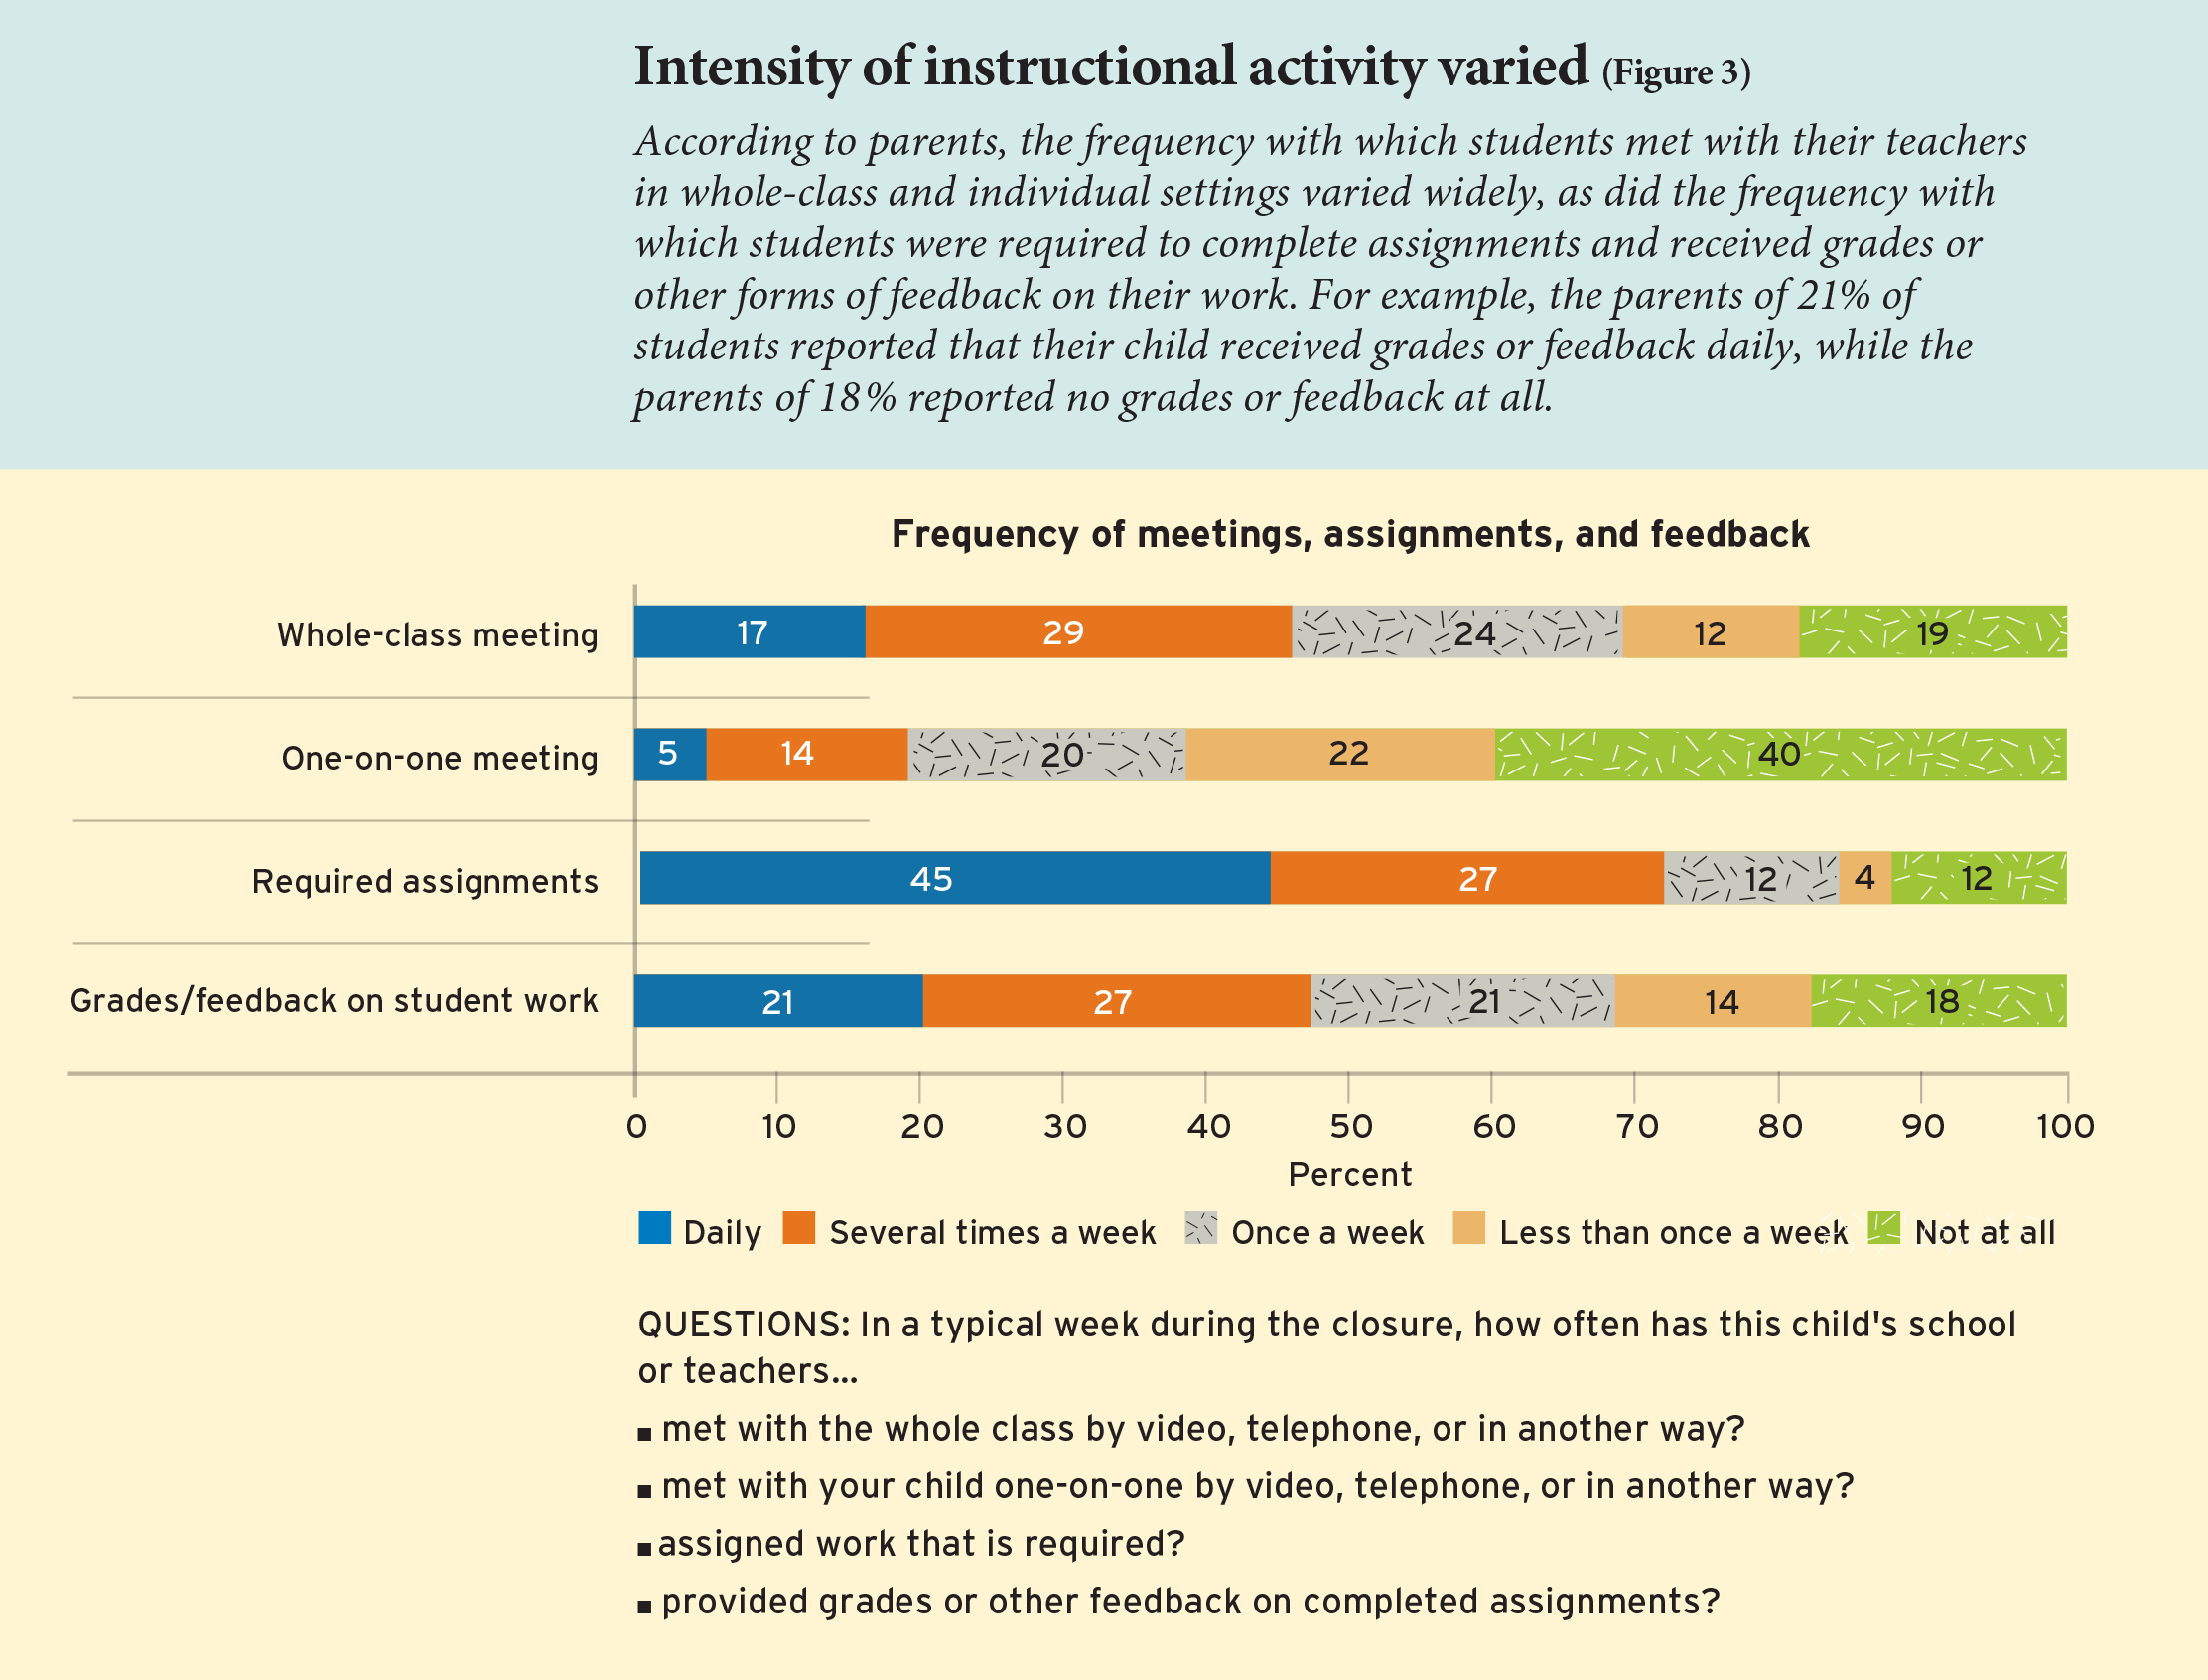
Thirty-one percent of the parents surveyed, reported whole class meetings, assignments, and feedback with teachers happened less frequently than once per week if at all. Nineteen percent reported no whole class meetings at all. One-on-one meetings were reported as even less frequent with 40 percent reporting zero and 22 percent reporting less than once per week.
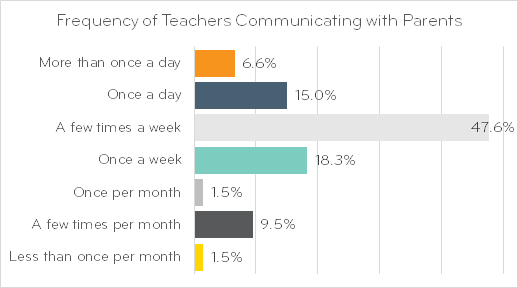
Teacher Contact

Parents were not satisfied with the intensity of remote instruction. This was reflected in the low satisfaction rate of parents. Only 22 percent of parents were satisfied with less whole-class meetings didn’t occur more than once per week, one-on-one meeting satisfaction was 24 percent, required assignment satisfaction was 20 percent, and feedback and grade satisfaction were 21 percent.

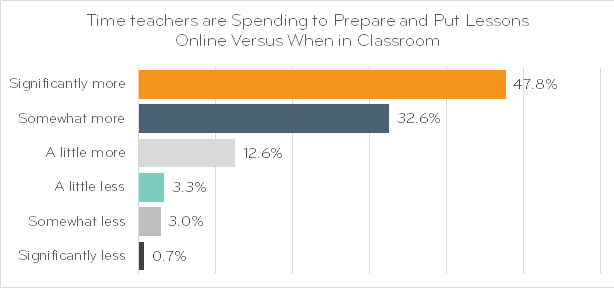
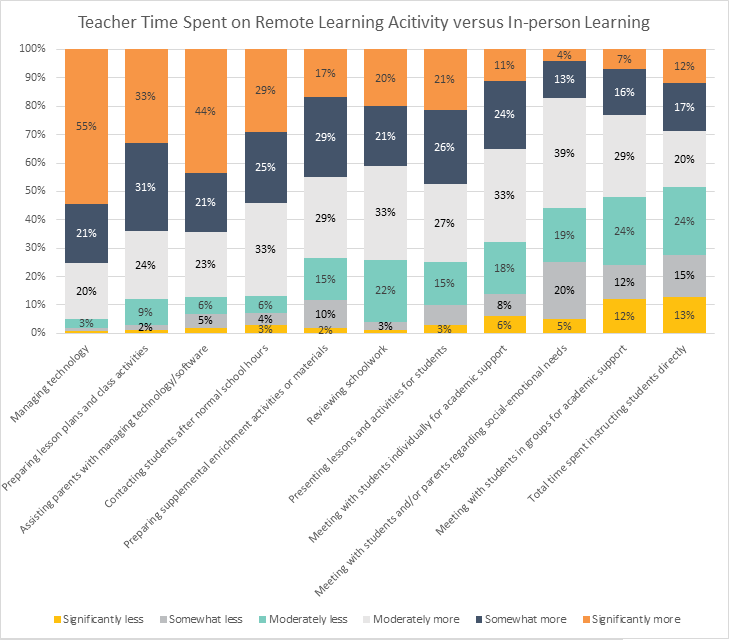
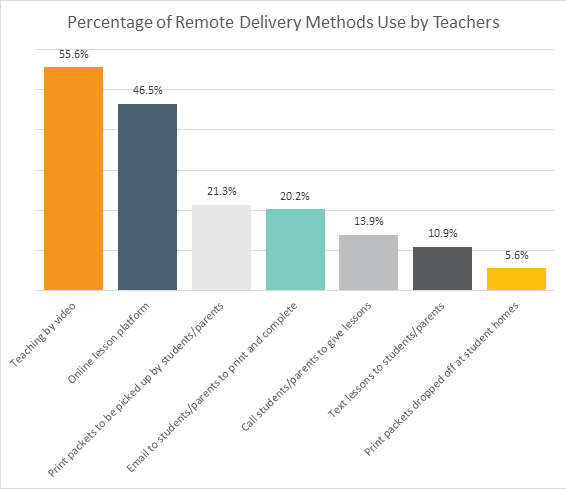
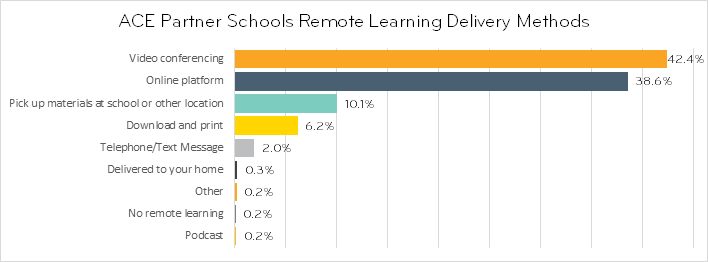
Due to the remote learning ACE partner school teachers are spending more time on activities other than learning in the new online reality. Teachers report 96 percent time managing technology, 88 percent more time preparing their online lesson plans, and 88 assisting parents with the remote learning technology.
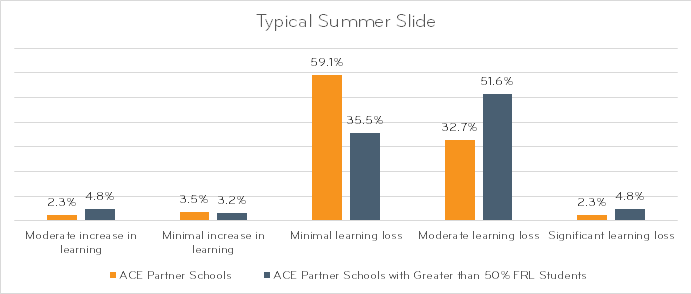
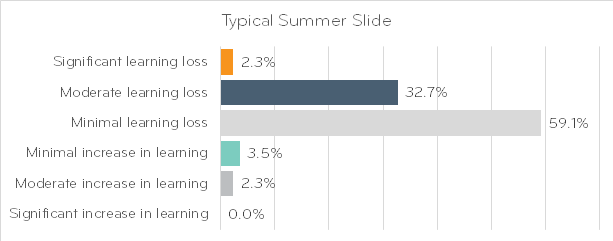
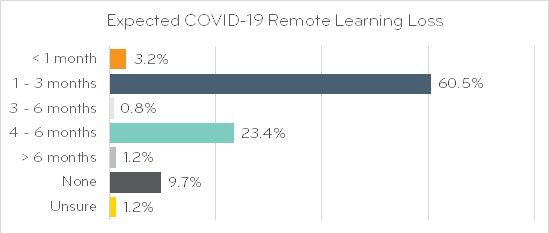
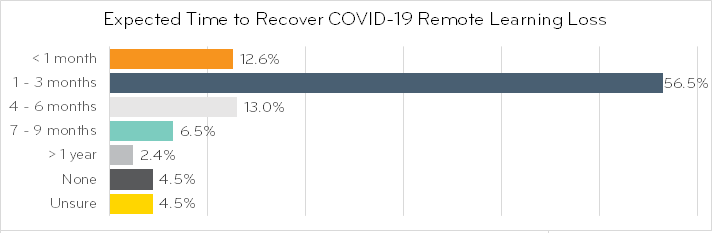
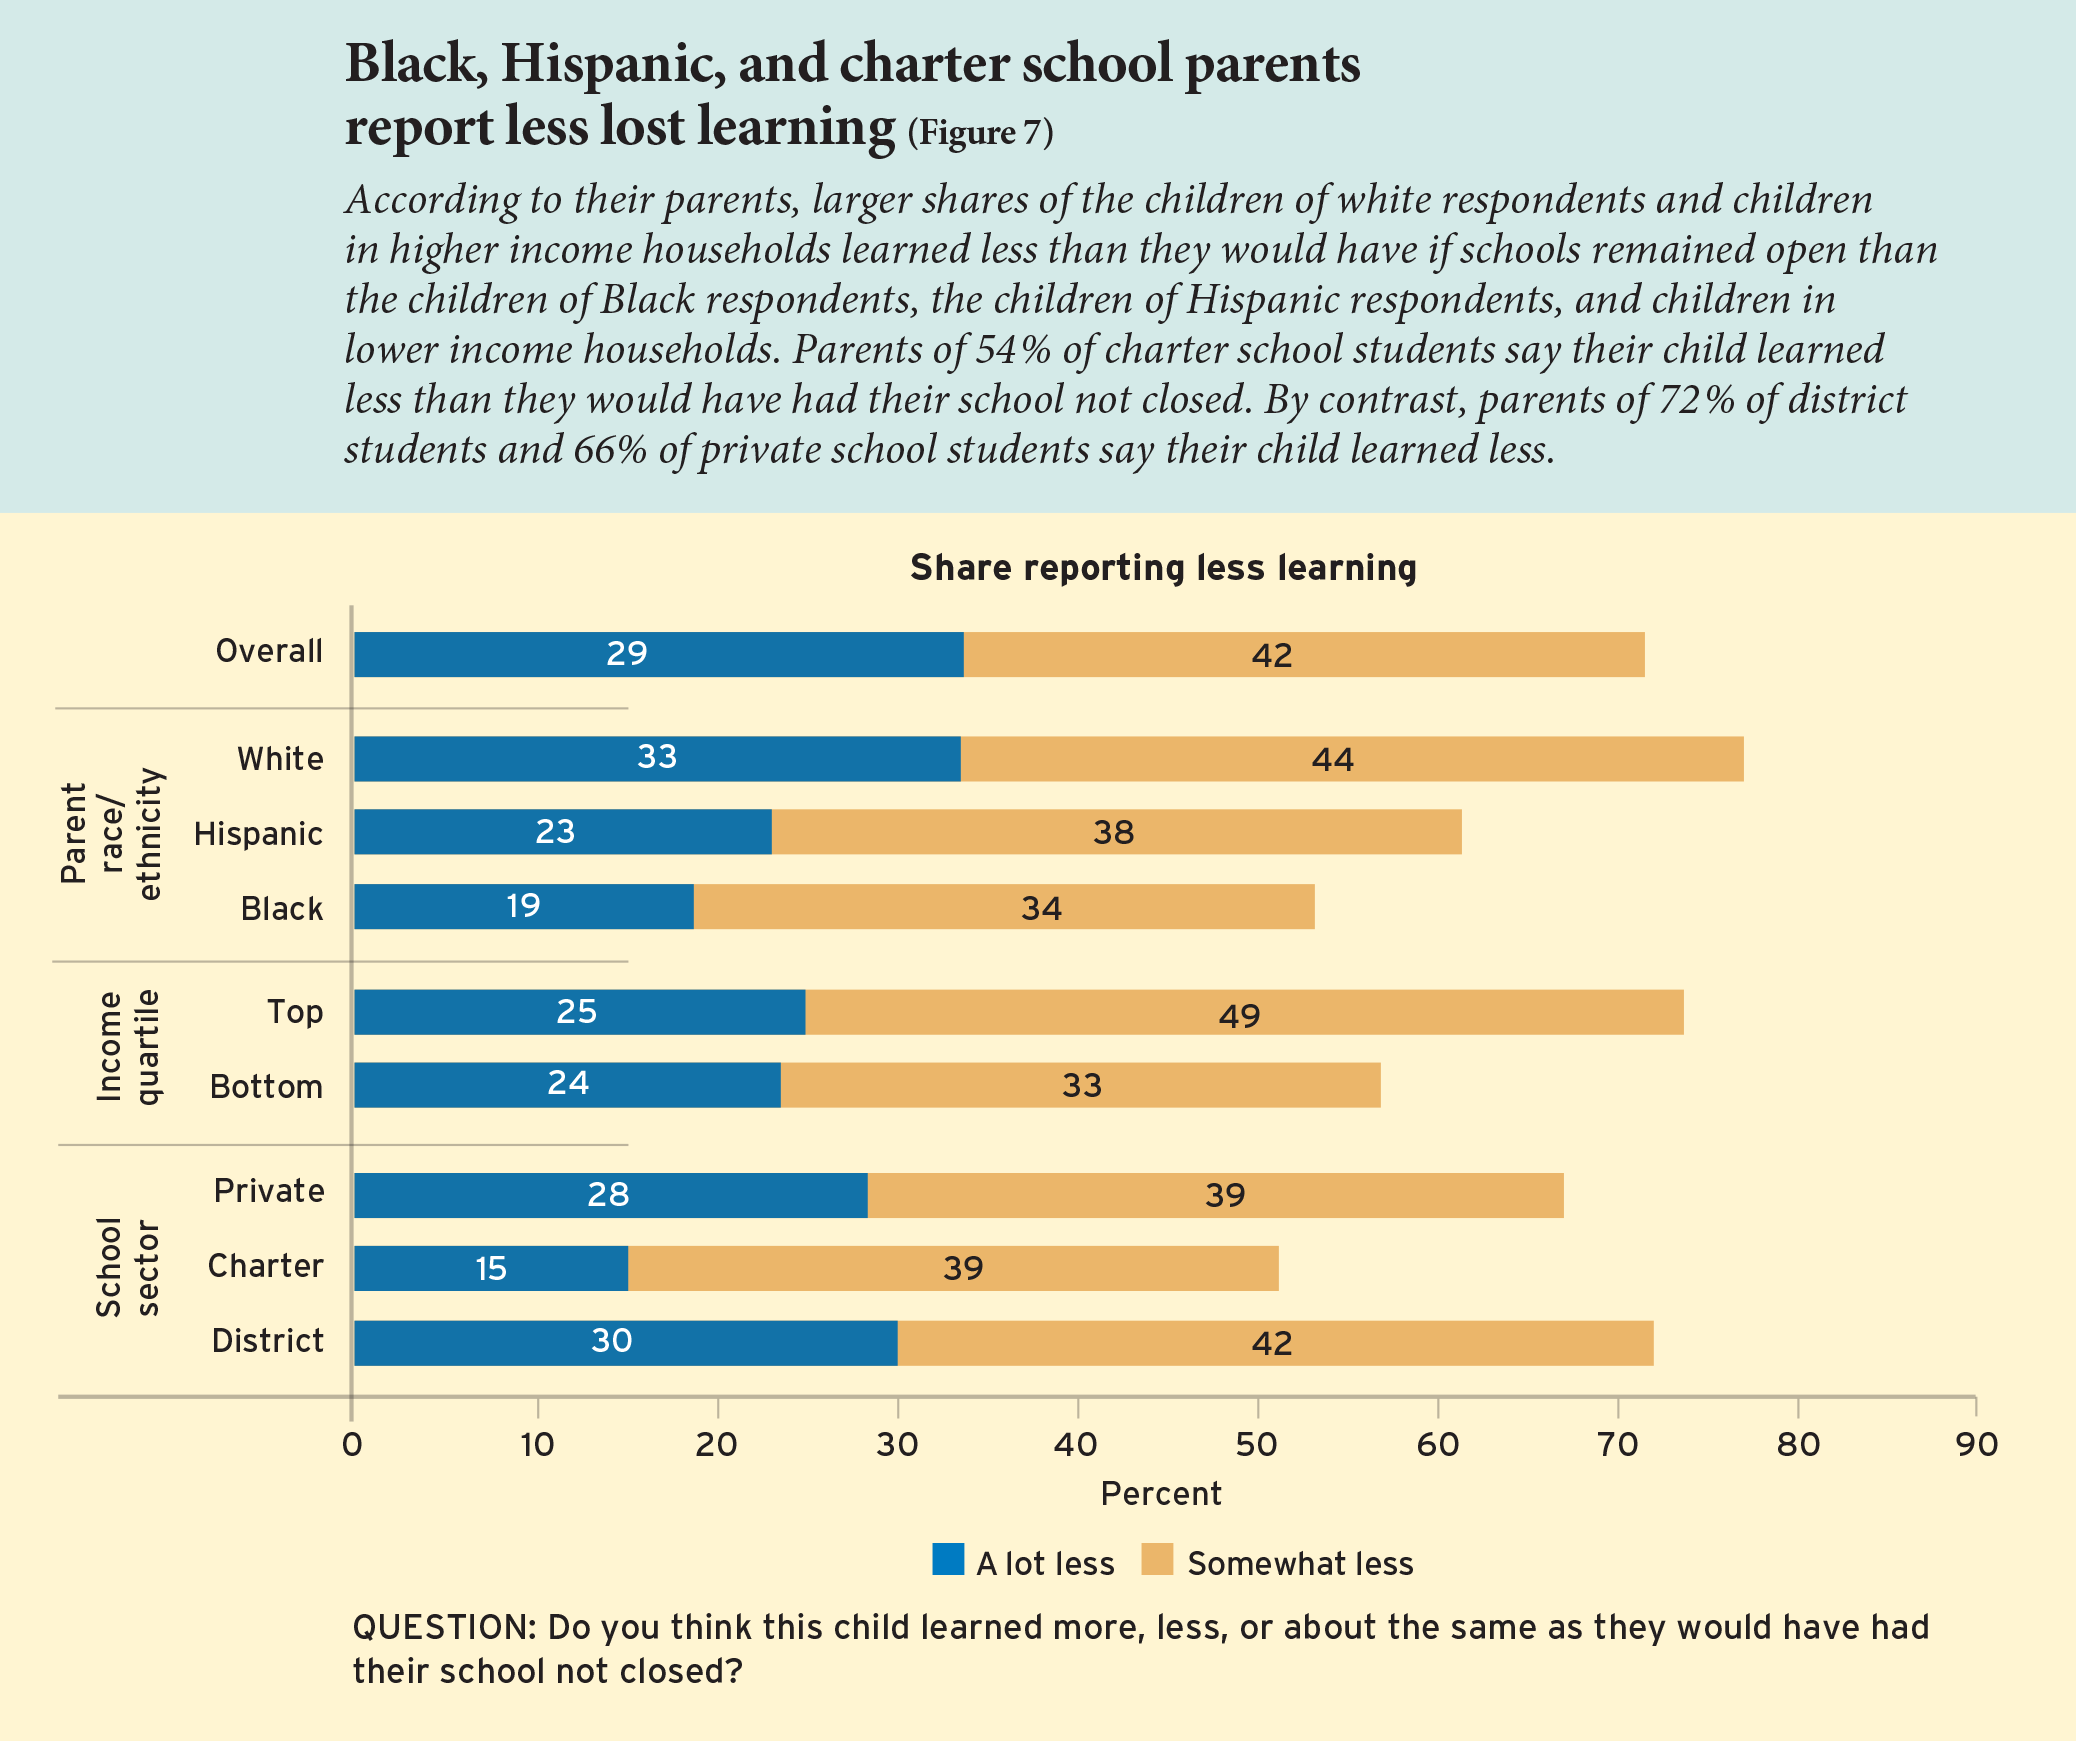
Learning Loss

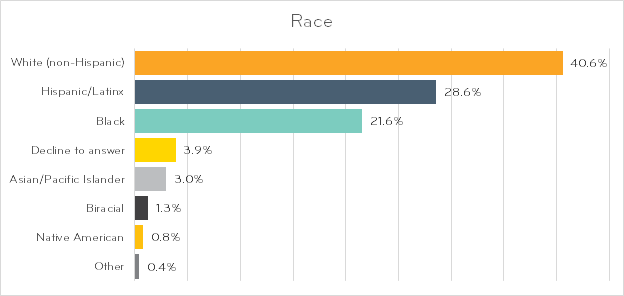
Seventy-two percent of parents in traditional public schools reported that their children learned less at home than if their school had remained open, while only 54 percent of charter school parents and 67 percent of private school parents reported the same. Interestingly, 77 percent of white parents reported they believed their children learned less remotely, with Hispanic parents reporting 61 percent and black parents at 53 percent. The top quartile parents reported in at 74 percent, while the bottom quartile reported in at 57 percent.

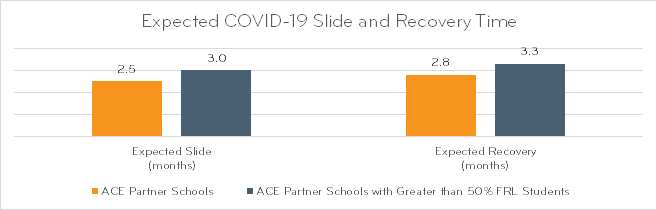
ACE partner schools estimated the median COVID slide learning loss to be 2.5 months and recovery to take nearly 3 months. Some school feared it would take an entire school year to recover what was lost. The loss and recovery for low-income students was an extra half a month more than students in general.

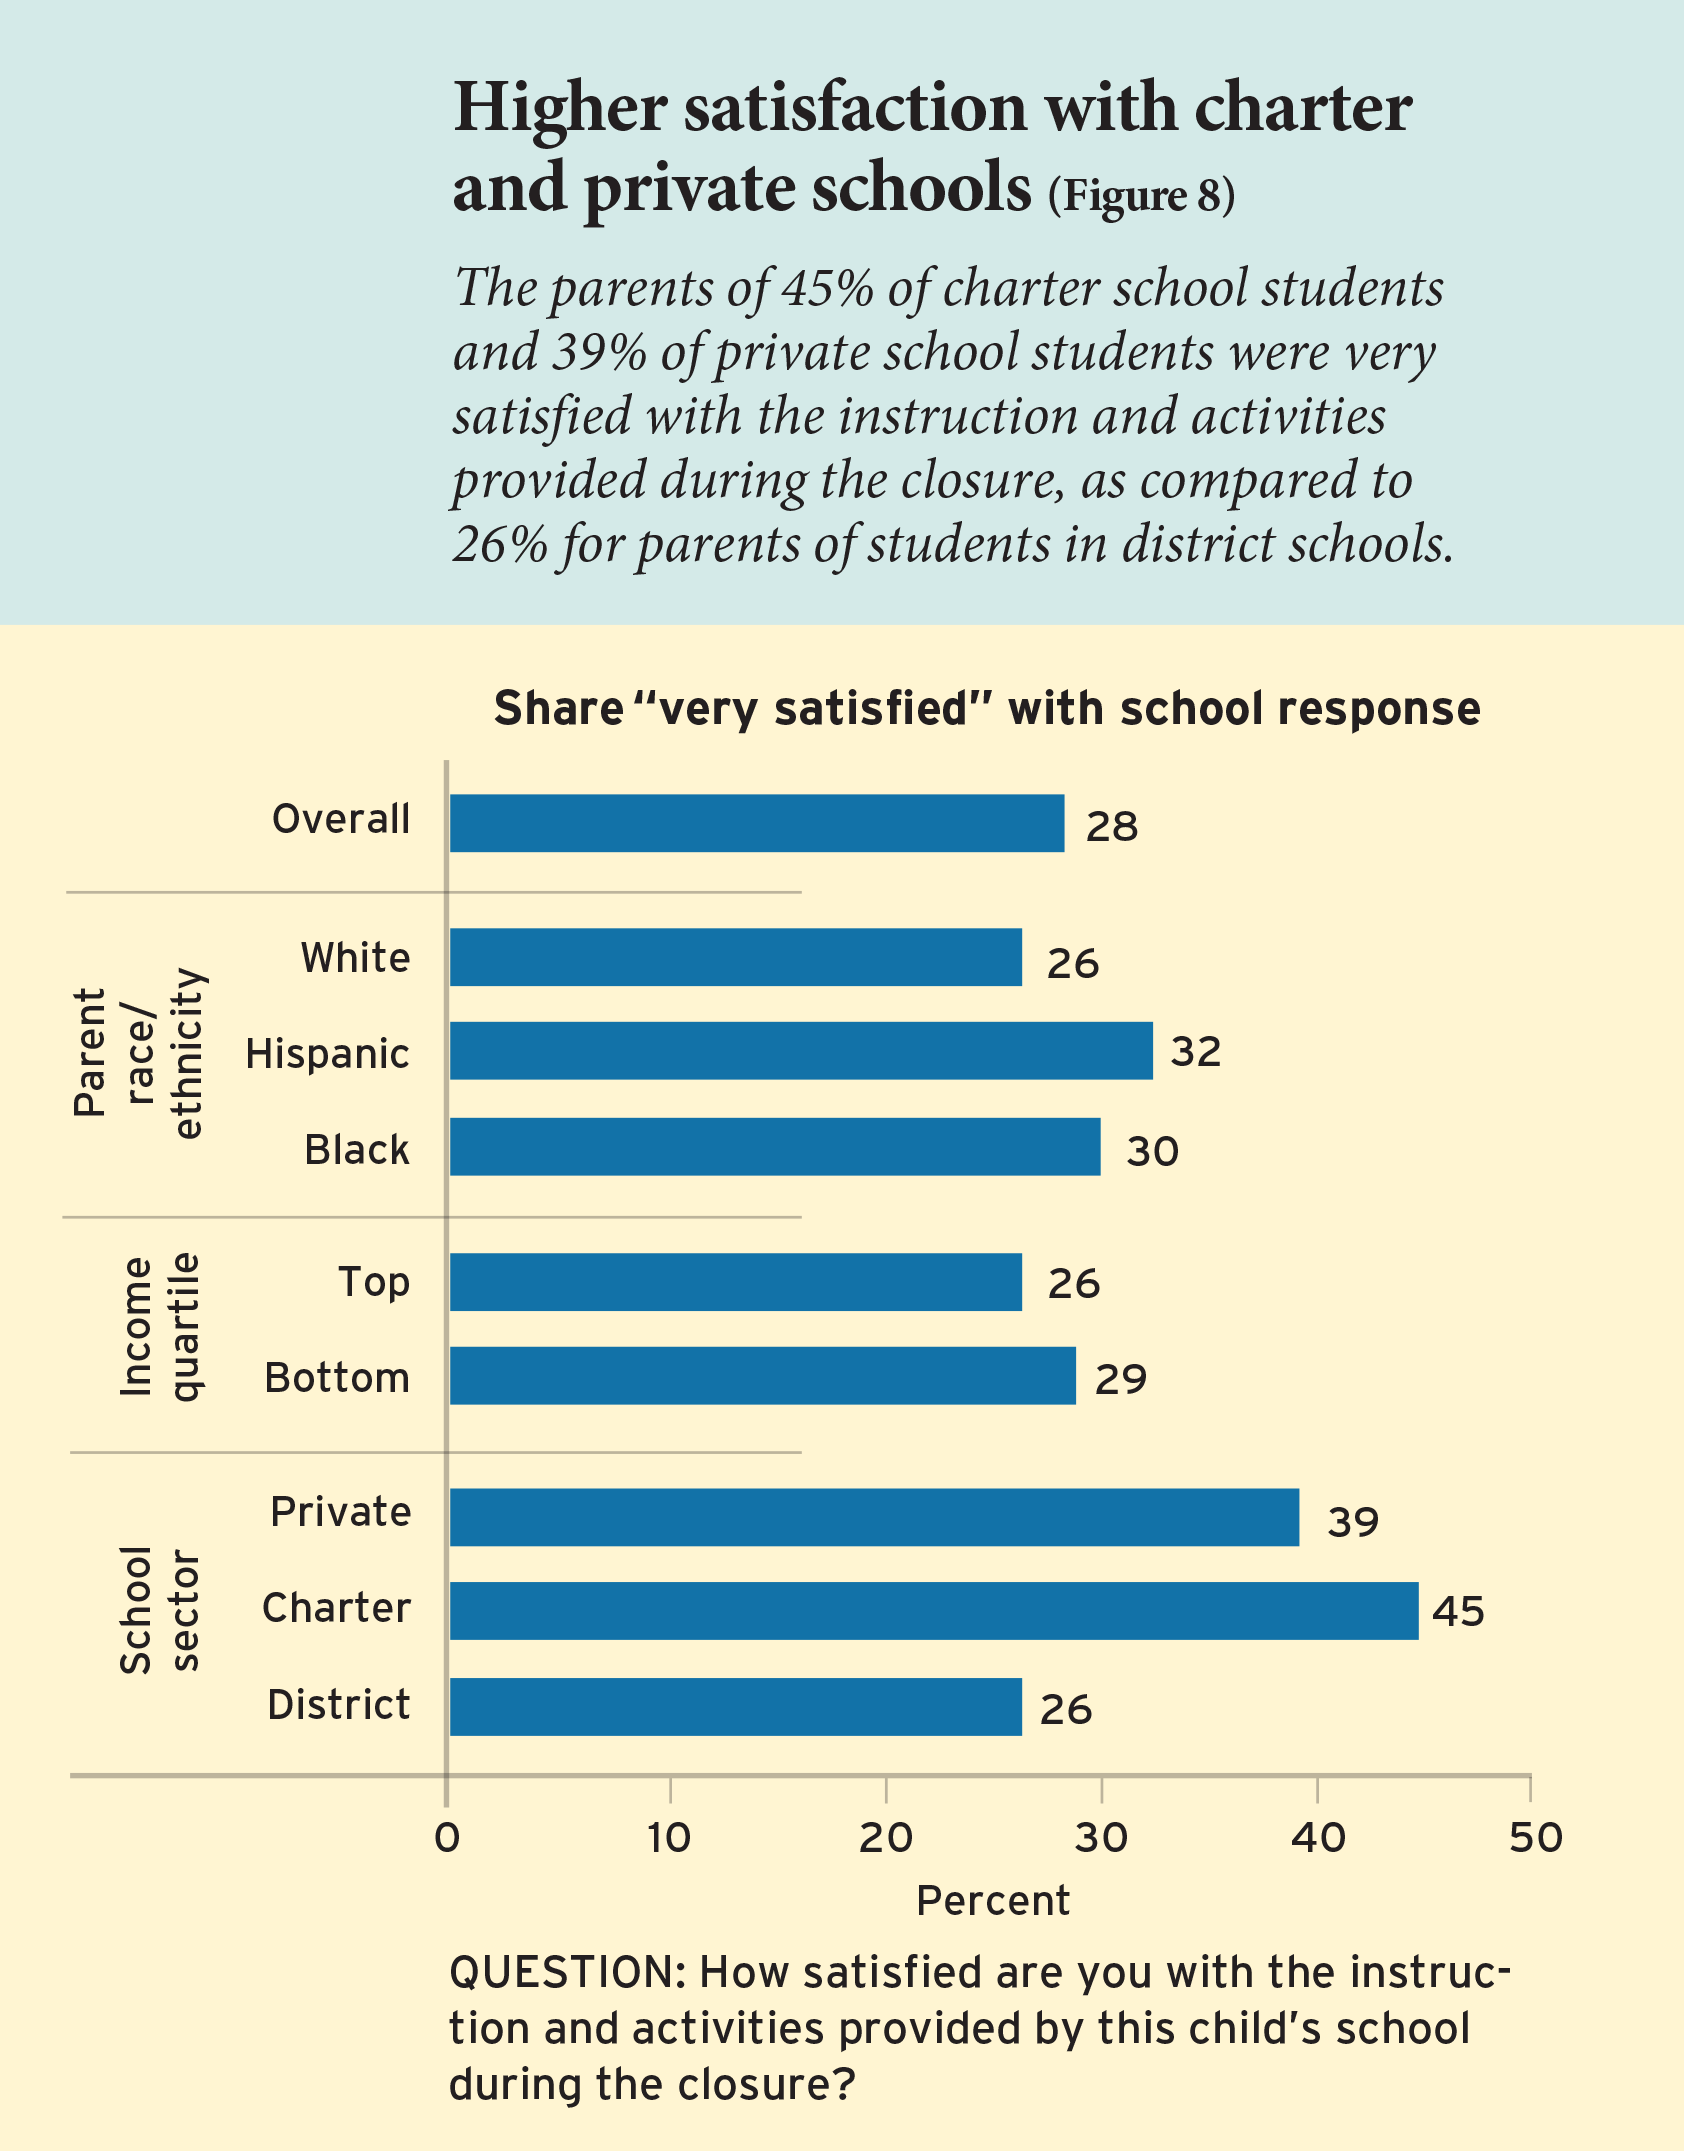
Parental Satisfaction

It comes as no surprise parents were not satisfied with how schools shifted to remote learning. The top and bottom income quartiles ranked their satisfaction at 26 and 29 percent respectively. The one brighter spot was charter school parents raking satisfaction at 45 percent, and private school parents at 39 percent. Only one in four (26 percent) parents at traditional public schools were satisfied.

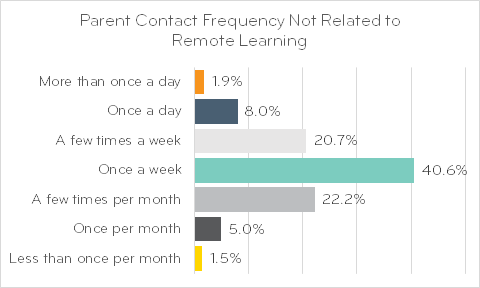
Some of this low parent satisfaction could be attributed to the frequency of schools communicating with parents. Ninety-nine percent of private schools reported communicating with parents at least once per week with 55 percent of those reporting multiple contacts per week, 16 percent daily contact, and 14 percent making multiple contacts per day.

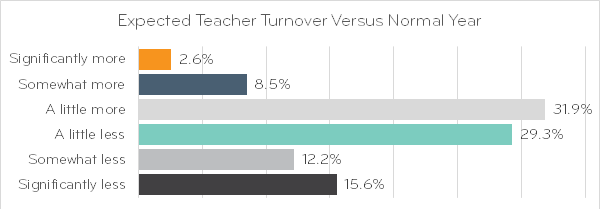
Parental dissatisfaction of remote learning appears to be one of the reasons many parents did not return their children to school this fall. Parents are choosing from a myriad of options. Many private school students are returning to public school due to financial issues, some public school students are moving to private schools due to them returning to in person learning, others are opting to homeschool, or find a micro-school (a specialized school within a school).  Instead, some opted to start pandemic pods. Pandemic pods are families and neighbors joining together to teach, or hire a teacher for, their children in small groups at each other’s homes.

Student Engagement

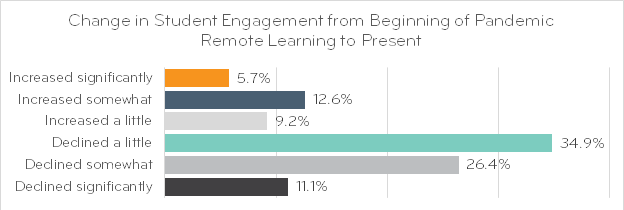
ACE partner schools reported a decline in student engagement of 72 percent as the remote learning continued. A significant decline was reported of one in ten students. This disengagement appears to have continued into the fall with schools reporting an increase in failure rates. In Brazosport, TX students back in class have a “failure rate of 8 percent,” while 25 percent of virtual students are failing at least two classes. An Austin, TX middle school was seeing and almost 25 percent failure rate of at least one class.  Across Austin ISD the failure rate has increased by 70 percent and the Hays CISD reported a 30 percent in student failures. Hondo, TX reports a 63 percent failure rate.

This failure rate is not just happening in Texas. It is happening in other states as well. Districts in the San Francisco Bay Area are reporting 30 to 50 percent increases in their failure rates. Los Angeles is seeing a surge in Ds and Fs.

The Solution

There is a simple solution to enable the problems created by the pandemic to be solved. That solution is individualized education funding which would allow every parent to find and select the education that best works for their child. This individualization would allow parents to find a school with in-person learning (public, private, or charter), finding a remote learning solution that fits their child’s needs (public, private, charter, or third party), home schooling, pandemic pods (families joining together to teach their children), micro-schools (small schools within a school), or any other education model.

ACE Partner Schools COVID-19 Free and Reduced Lunch Student Impacts

Digging deeper into the school survey data report, specifically, to see how our partner schools who serve 50 percent or more free and reduced lunch (FRL) students were faring. While most of the numbers are very similar to the full dataset, there was some data showing how FRL students, and schools, have experienced more detrimental effects and why what we do is so very important to low-income families.

The key academic findings for these FRL heavy schools are:

    • a greater learning loss during the typical summer slide
    • the COVID slide is expected at 3 full months as compared to 2.5 months for the entire network
    • the COVID recovery is expected to take 3.3 months as compared to 2.8 months for the entire network
    • five-percentage points less likely to meet class requirements during remote learning
    • parents were less effective in assisting with remote learning with a
        • 10-percentage point gap in grades 3 – 5
        • nine-percentage point gap in grades 6 – 8
        • five-percentage point gap in grades 9 – 12

Schools reported greater impacts on social and emotional well-being. The key findings show:

    • a five-percentage point greater impact on coping skills
    • a three-percentage point greater impact on relationship skills
    • a three-percentage point greater impact on emotions

Eighty-two percent of these schools will be implementing social emotional learning (SEL) into the 2020-2021 school year. This is a 12-percentage point increase as the whole network.

The chart below shows the typical summer slide. Schools report FRL students experience more learning loss over a typical summer.

For the COVID slide, these same partner schools expect a half month more learning loss and a half month longer recovery. This is a significant burden on schools and the students who have fallen further behind than normal.

The COVID slide is to be expected given the five-percentage point decrease in students meeting class requirements as compared to all ACE partner schools.

While parents were willing to assist their children with remote learning, schools with more FRL students say parents are less effective in their assistance. Specifically, in 3 – 5 grades, there is a 10 percentage point gap, a nine-percentage point gap in grades 6 – 8, and a five-percentage point gap in grades 9 – 12.

The social and emotional impact of COVID-19 has hit the FRL students harder. This is evidenced by schools reporting greater impacts in coping skills (five percentage points), relationship skills (three percentage points), emotions (three percentage points), and learning (two percentage points).

Eighty two percent of schools serving a larger percentage of FRL students are planning to implement social emotional learning (SEL) into the 2020-2021 school year whereas 70 percent of all ACE partner schools are planning additional SEL implementation.

ACE Partner School COVID-19 Survey Findings

ACE Scholarships (ACE) has undertaken several surveys to determine what partner schools and parents experienced due to the pandemic and subsequent remote learning. In addition, we looked forward to the upcoming fall school year to find out plans and needs.

Key findings on remote learning:

    • Nearly 50 percent of classes cannot be effectively taught online in elementary school.
    • Schools report student engagement has declined by more than 70 percent overall from the beginning to the end of the school year remote learning.
    • More than two-thirds of partner schools provided remote learning devices or Wi-Fi access to all or students who needed them. Another 20 percent would have provided them if they had the funds to do so.
    • Almost two-thirds of partner schools added social and emotional learning (SEL) and coping to aid their students and families. SEL will be continued by schools in the coming 2020/21 school year.
    • Fifty percent of schools maintained direct student interaction via online platforms and did not want nor plan to outsource that to third party remote learning systems.
    • The three highest priority needs for teachers are:
      • training to understand how remote learning differs from in-person learning,
      • remote learning technology training, i.e. video conferring and online lesson platforms,
      • and maintaining connectivity among educators.
    • Teachers are spending significantly more time:
      • managing technology (96 percent),
      • assisting parents with managing technology (88 percent),
      • and contacting students after normal school hours (87 percent).

Key findings on remote learning loss or the ‘COVID slide’:

    • More than 60 percent of schools estimate the loss to be one to three months.
    • The median learning loss estimate is 2.5 months.
    • Learning loss recovery is mixed:
      • The median recovery of the learning loss is 2.8 months.
      • 16 schools expect the learning loss recovery to take almost the entire school year.
      • Six schools expect recovery to take multiple school years.

Key findings on COVID-19 related costs to schools (included tuition loss):

    • The median cost to partner schools is $112, 617.
    • ACE partner schools serve on average 36 percent of low-income students with a high of more than 49 percent in Louisiana and 23 percent in Montana.

Key findings for families:

    • Almost 60 percent of families believe life after COVID-19 will be somewhat or much harder.
    • More than 63 percent of families suffered fiscal impact due to the shutdowns.
    • More than 12 percent have no or limited access to remote learning technology. The highest technology barriers are:
      • Limited or no high-speed internet access (62 percent)
      • Lack of access to required hardware (36 percent)

Schools, parents, and students have concerns over remote learning versus in-person learning. The amount of course work that schools report cannot be taught effectively remotely is highest in elementary school and decreases into high school, i.e. the younger a child is the more direct and personal instruction they need.

In addition to the classes that cannot be effectively taught online, teachers are spending more time preparing their lessons to put online. They are spending more time managing technology than before, while spending less time instructing students.

As the pandemic shutdown progressed, schools report student engagement decreased over time with almost 35 percent by a little, more than 26 percent somewhat, and 11 percent with a significant decline.

The social and emotional impact of the pandemic shutdown could have contributed to the decline in engagement since almost two-thirds of partner schools reported adding social and emotional learning (SEL) and coping to aid their students and families. These schools are planning on continuing and even adding more SEL this coming school year.

Besides the declining student engagement, many students had barriers to remote learning with the lack of laptops, iPads, etc. and the lack of reliable high-speed internet access.

Many schools did provide students with devices and WiFi if they could afford to do so.

Almost 51 percent of schools maintained direct student interaction via online platforms and did not want nor plan to outsource that to third party remote learning systems. Schools feel it is more important for many students to have direct instructional contact with their regular teachers instead of a third-party learning system.

The rapid transition to remote learning left many teachers scrambling. Schools rank their top two needs as training to understand how remote learning differs from in-person learning and training on how to use video conferencing and other online platforms.

Teachers are not immune to the social and emotional impacts of exclusive remote learning. Schools ranked the need to maintain teacher connectivity and social and emotional support for staff as the third and fourth greatest needs.

Another key element of the pandemic induced remote learning is what many are calling the “COVID slide”. To gage the impact on students at ACE partner schools, we asked about the typical summer slide, the COVID slide, and the time needed to recover the lost learning. This is what we found. There is minimal learning loss during the typical summer slide. The average learning loss due to the COVID slide is estimated at 2.5 months, with a recovery time of 2.8 months. Recovery time is very mixed with 16 schools expect the learning loss recovery to take almost the entire school year and six schools expect recovery to take multiple school years.

Private schools have taken a financial hit in conjunction with the learning loss. The median cost to partner schools is $112, 617. On average, these schools serve 36 percent of low-income students with a high of more than 49 percent in Louisiana and 23 percent in Montana.

Families were also hit hard economically with loss of jobs, reduced hours, or the need to stay home due to their children’s school being shut down, and loss of loved ones.

This impact will be long-lasting according to the families. They shared their concern that life is not going to return to normal anytime soon with almost 60 percent saying life after COVID-19 will be somewhat or much harder.


ACE Scholarships Partner School Survey Questions and Results

Surveys Emailed: 638

Survey Responses: 323

  1. Prior to the COVID-19 pandemic, did students at your school regularly engage in remote learning?
  2. How are remote learning lesson materials delivered to families?
  3. Did your school provide iPads, laptops, WiFi hotspots, ect. to students or families during the COVID-19 pandemic?
  4. Have you implemented any additional social and emotional support into the classroom during this period of remote learning?
  5. Please describe the additional social and emotional support you have implemented:
  6. Are you currently using any third party distance learning service?
  7. Please rate your satisfaction level with your current distance learning service? [Only rate products that you currently use]

    *Some schools use multiple platforms.
    **Other platforms include those with single-digit usage and include: Abeka Academies, Alpha Omega, Apex Learning Virtual School, Bob Jones University, Class Dojo, Edgenuity, FlipGrid, FuelEd, Ignitia, Instructure, IXL, Jupiter Ed, K12 Academies, Lalilo, Lexia Learning, Mindspark Learning, Pearson Online Academy, Schoology, Typing.com, Veritas Learning Lab, Wittenberg Academy, Xtra Math

  8. What percentage of each remote learning delivery method are your teachers using?
  9. Please rank your staff needs to facilitate better remote learning? [Only rank the items your staff needs]
  10. Please rate the time your teachers are spending on each of the following aspects of teaching during the pandemic versus before the pandemic: [Only rate items your teachers are spending time on]
  11. How much time are your teachers spending to prepare and put their lessons online as compared to when they were in the classroom?
  12. What percentage of lessons cannot be effectively taught/performed online (labs, experiments, hands-on lessons, etc)?
  13. How frequently are teachers communicating with parents?
  14. What is your school’s expectation for teacher turnover in 2020-2021 as compared to a normal year?
  15. What do your students need to succeed in a remote learning environment? [Only rank items your students’ need]
  16. How has student engagement changed from the first day of the pandemic remote learning to the present?
  17. How frequently are students required to _________?
  18. How many students are meeting these class requirements?
  19. How frequently has your school been communicating with parents for reasons other than remote learning during the pandemic?
  20. What methods are you using to communicate with parents? [Check all that apply]
  21. How effective have parents been at assisting with at-home learning for the following grade levels? [Only rate grades that are applicable to your school]
  22. How willing have parents been to assist with at-home learning for the following grade levels? [Only rate grades that are applicable to your school]
  23. Thinking about the 2019-20 school year, how are you handling grade promotion?
  24. Please estimate your expectation for student enrollment changes for your school for the 2020-21 school year?

    This data is unusable.  It showed an average of 39% increase with none saying any loss of students. They appeared to misunderstand the question.

  25. What are your plans for your school for the 2020-21 school year?
  26. What is the main reason you are closing permanently?

    Two schools responded and both said Loss of tuition revenue

  27. How would you rate the typical summer learning slide of your students?
  28. How many months of learning loss do you expect due to the impact of COVID-19 related issues?

    Average expected learning loss due to remote learning due to COVID-19 is 2.5 months.

  29. How long do you believe it will take an average student at your school to recoup learning losses suffered during the pandemic?

    Average time schools expect students to regain their education losses due to the COVID slide is 2.8 months. Sixteen schools expect learning recovery to take almost one entire school year and six schools expect it to take more than one school year.

  30. How would you rate the social and emotional impact of the COVID-19 crisis on your students?
  31. Will you be implementing any social and emotional support into the classroom for the 2020-21 school year?
  32. School Affiliation
  33. Grade levels served [Check all that apply]
  34. Tuition
  35. Population Density
  36. Please indicate costs, and if possible, estimated amounts incurred by your school as a result of COVID-19. This can be a total sum or a list of items and their individual costs.

    The average COVID-19 costs and loss of revenue for the schools that could identify their costs, the average is $112,617.


  37. What percentage of students does your school serve who meet the guidelines of the federal free and reduced-price lunch (FRL) program?

ACE Scholarships Family Survey Questions and Results

  1. Has your family been financially impacted through involuntary loss of job or unpaid leave?
  2. Do you work in an essential industry?
  3. How would you describe your relationship to the children living in your house?
  4. Do you have access to the technology needed to accommodate remote learning for your children (high-speed internet, computer availability, etc.)?
  5. What is the primary barrier to remote learning?
  6. How many devices (computers, tablets, etc.) in your home are available or readily accessible for remote learning?
  7. How does your child’s school deliver its remote-learning lessons?
  8. How have COVID-19 and the related closures affected your life, family situation, and learning experience for your children? (Please describe in the box below)
  9. After the COVID-19 crisis, life will be:
  10. Have you or your school undertaken any efforts to serve your community during this time of crisis? (Please describe these efforts in the box below)
  11. Would you be willing to share your family’s story on the impact of the ACE scholarship received? (Interview for written story, video recording, etc.)
  12. School Affiliation
  13. Household Income
  14. Age
  15. Race
  16. Gender

ACE National Family COVID-19 Survey Findings

ACE Scholarships (ACE) provides more than 7,000 scholarships to economically disadvantaged students attending more than 700 K-12 partner private schools in Arkansas, Colorado, Kansas, Louisiana, Missouri, Montana, Texas, and Wyoming. COVID-19 and the shutdown of schools and businesses have impacted these families and schools greatly. We surveyed all ACE families to get a better sense of how families are dealing with and how they are coping with this extraordinary crisis. The response rate was 26 percent or 1,313 families.

Key Findings:

A majority of families have been financially impacted by the loss of jobs, reduced hours, or the need to stay home due to their children’s school being shut down.

This impact will be long-lasting according to the families. They shared their concern that life is not going to return to normal anytime soon with almost 60 percent saying life after COVID-19 will be somewhat or much harder.

Economically disadvantaged families know the difficulties of living paycheck to paycheck. When their paycheck stops it hits them harder than most due to a lack of savings. This puts them further behind making a long road to recovery. ACE families, in particular, are acutely aware of the sacrifices they must make to have their child in a better and safer education environment. These financial sacrifices will be even harder due to the expected long-term nature and probability of the COVID-19 return this fall.

This pandemic has affected families’ physical and mental state. Using several oft-repeated keywords and phrases, shown in this word cloud below there is a general theme that is readily apparent. There is much anxiety, fear, and worry about the immediate future, families are using this time to build closer family bonds and help others.

These are a few of the example responses we received. (These survey responses have been altered for spelling and to ensure anonymity.)

  • Family members have died from COVID-19. Not being able to be together & having to continue with school and work was surreal.
  • No in-person church services. Parks are closed. Cannot see friends or be around people. This lifestyle is promoting isolationism.
  • We only have one tablet for three kids to use for their classes. I haven’t worked since early March.
  • The economic situation is dire; family situation stressful; and the learning experience is an adjustment.
  • It has upended a lot of our plans as a family. My youngest can’t go to school. We can’t afford private school next year if this continues in the fall.
  • We are gathering as a family every night for dinner and prayer which has been awesome. It’s been a challenge not being able to work, and the children not being able to go to school, but they have adapted well.
  • We can’t afford to pay all our bills at this time due to getting furloughed. My child has increased anxiety and depression from the closure of schools and struggles without a teacher being present to help her.
  • I am a small business owner and my business closed. I am not receiving any income currently. It’s been a little hard to get used to being on a school schedule, but we are trying to stay on top of it.
  • My child is becoming depressed and not engaging.
  • I healthcare worker caring directly for COVID-19 patients. My child must live with other family so as not to be exposed.

Schools, communities, and families themselves are finding ways to serve the neediest even with their own hardships. This is highlighted in the word cloud and example quotes below.

(These survey responses have been altered for spelling and to ensure anonymity.)

  • I have been helping a group with an Adopt a Senior (gifting program for graduating seniors). I’ve been volunteering 10 to 14-hour days to help keep up on social media page to ensure seniors and sponsors are in contact so all seniors get a sponsor.
  • We’ve been chalking positive things in people’s driveways and praying as a neighborhood community while practicing social distancing.
  • School has reached out to see if we need anything, however they are struggling financially too.
  • Several parents are serving other families in our school community allowing working parents to drop off their kids and go to work peacefully. Parents make and take food to families in need. We pray together. We use technology to share beautiful moments, like birthday parades, senior parade, and student packages.
  • My second grader learned to sew and made over 200 masks to donate to nursing homes and cancer centers.
  • We made signs of support for essential workers and put them on lawns of healthcare workers in our community.
    • We helped some people worse off than us with food and money to solve their immediate needs. The school is helping the school community by giving us time to pay the tuition and re-registration fees.
    • School provides grocery gift cards for needy families. My children have written notes to people in assisted living who aren’t able to have visitors along with writing thank you notes to health care workers.
    • We gather at the end of every day and talk about news and new things happening, how we can help the way we have been helped…. pray for all of those in need and give thanks for what we had received. We love our life day by day, “God will provide.” We are very thankful for all you guys do for all of us in need.

Due to the school shutdowns, schools have unexpectedly had to find ways to facilitate distance learning. Nearly 75 percent of ACE partner schools deliver via online and video conference platforms. However, not all schools have relied on the internet for lessons and instruction. Some have allowed families to pick up hard-copy materials, and others have used calling or texting to get coursework to students.

While most families have been able to cope with a predominantly online approach to school, more than 12 percent of low-income ACE students have had to cope with substantial barriers that can inhibit their access to learning.

For the families that faced access barriers to online remote learning, the main issues are the lack of high-speed broadband internet or the lack of computer devices. Almost 36 percent of students lack access to a computer, tablet, or device needed for online learning. More than six in 10 students either do not have internet available in their area, cannot afford broadband internet service, or have slow internet and connectivity issues.

To review all the data, click here to review the full survey.

Individual state reports:

Louisiana Family COVID-19 Survey Findings

ACE Scholarships (ACE) provides more than 1,500 scholarships to economically disadvantaged students attending 147 K-12 partner private schools within the state of Louisiana. COVID-19 and the shutdown of schools and businesses have impacted these greatly. We surveyed 1226 Louisiana ACE families to get a better sense of how families are dealing with and how they are coping with this extraordinary crisis. Three hundred thirty-four families responded to the survey giving us a response rate of 27.2 percent.

Key Findings:

A majority of families have been financially impacted with loss of jobs, reduced hours, or the need to stay home due to their children’s school being shut down.

Financial impact to household income

Due to the school shutdowns, schools have unexpectedly had to find ways to facilitate distance learning. Nearly 75 percent of ACE partner schools deliver via online and video conference platforms. However, not all schools have relied on the internet for lessons and instruction. Some have allowed families to pick up hard-copy materials, and others have used calling or texting to get coursework to students.

What are the delivery methods being used by ACE partner schools to facilitate remote learning

While most families have been able to cope with a predominantly online approach to school, 15 percent of low-income ACE students have had to cope with substantial barriers that can inhibit their access to learning.

Access to technology needed for remote learning

For the families that faced access barriers to online remote learning, the main issues are the lack of high-speed broadband internet or the lack of computer devices. Nearly four out of every 10 students lack access to a computer, tablet, or device needed to online learning. More than six in 10 students either do not have internet available in their area, cannot afford broadband internet service, or have slow internet and connectivity issues.

Barriers to remote learning

Looking to the future, families shared their concern that life is not going to return to normal anytime soon. Economically disadvantaged families know the difficulties of living paycheck to paycheck. When their paycheck stops it hits them harder than most due to a lack of savings. This puts them further behind making a longer road to recovery. ACE families, in particular, are acutely aware of the sacrifices they must make to get their child in a better and safer education environment. These financial sacrifices will be even harder due to the expected long-term nature and probability of the COVID-19 return this fall.

Family expectation of life after the COVID-19 crisis

In addition to gathering statistical data, the survey ask two qualitative, open-ended questions:

  1. How has COVID-19 and the related closures affected your life, family situation and learning experience for your children?
  2. Have you or your school undertaken any efforts to serve your community during this time of crisis?

The answers to these questions provided a deeper insight into the effects of COVID-19 on families’ physical and mental state. Using a number of oft-repeated key words, we were able to identify a general theme in these often very personal responses: Although there is much anxiety, fear, and worry about the immediate future, families are using this time to build closer family bonds and help others.

Some of the frequent words used in their responses were as follows:

Adjusting Afraid Anxious Checking on others
Coming together Depressed Difficult Encouraging others
Family bonding Financial worry Helping Hopeful
Scared Stressed Students falling behind Looking out for others
Lack motivation Missing family Missing friends Missing school
Overwhelmed Sorrow (loss of loved ones) Struggling with learning Thankful
Worried about family Worried about not being able to afford to return to their school this fall


Even though a large majority of ACE families have been financially impacted, they are still finding ways to be connected with their communities and assist others. Here are the most common ways families are helping others:

  • Baking for neighbors
  • Chalking encouraging sidewalk messages for neighbors
  • Donating blood
  • Making encouraging videos of acts of kindness around their town to share on social media
  • Making masks and donating to those on the front lines and others who need them
  • Making signs and placing them in yards thanking healthcare workers
  • Printing out school lessons for others
  • Running errands for neighbors (groceries, medicines, taking them to appointments, etc.)
  • Writing notes to healthcare workers, family, and the elderly

Schools and communities are also finding ways to serve their neediest students through this crisis. Below are the most common methods students and families are being helped.

  • Food boxes and meals for those in need
  • Offering devices to students who don’t have them
  • Offering professional, psychological, and emotional support to those who need it
  • Recording students thanking front line workers and distributing the video to those workers
  • Serving food to healthcare workers
  • Teachers are spending extra time helping students
  • Working with nursing homes to assist the elderly

To review all the data, click here to review the full survey.

ACE is also conducting this survey in the seven other ACE states to discover how different communities are responding to COVID-19.

The Trojan Horse of False “Improvements”


Can you improve a scholarship program by gutting it? The Center for American Progress (CAP) seems to think so. The organization recently published a brief laying out a handful of policy ideas to “improve” K-12 private school scholarship programs. Not surprisingly, nearly all of these suggestions would harm rather than help these programs and the kids they serve.

There’s a lot to swallow in the CAP report, so you can read through their entire list of “improvements” at your own leisure. For now, let’s just focus on a few big argumentative rocks.

“Voucher Program” is an inaccurate description of many choice programs. The CAP brief states in the fine print that “For the purposes of this issue brief, references to private school voucher programs are referring to all programs subsidizing private education.” And sure enough, the author uses that label to cover every K-12 scholarship program, regardless of form or mechanism.

The problem with this generalization is that it is objectively inaccurate from a policy perspective. Actual voucher programs use directly appropriated government money to fund K-12 private school scholarships. Scholarship tax credit programs, on the other hand, rely on tax incentives to encourage private giving to private nonprofits that fund scholarships. There is no government money involved. Don’t take my word for it, though. Ask the U.S. Supreme Court or the numerous state supreme courts that have tackled this issue.

Why bring up this point? Because it speaks to the intent of the brief. Someone seriously interested in improving or expanding K-12 scholarship programs would have at least ventured the effort to distinguish between radically different types of programs.

Phasing out programs and choking off scholarship funding is literally the opposite of improvement. CAP acknowledges that hundreds of thousands of students currently make use of private school choice programs (nearly 470,000, to be more precise), and that these families might be upset if someone cut their scholarships in the name of “improvement.” Their solution? Just don’t allow new kids into the programs and let natural attrition run its course.

This suggestion might be worth considering if we had reason to believe that a) we have already met all the current need for expanded access to private options, and b) every single student has access to a high-quality public school. Of course, neither of those things is true. Demand for scholarships exceeds availability by orders of magnitude in most places, and the public school system has made exceedingly little meaningful progress in the past decade.

Throw into the equation the fact that parents choose schools for a huge variety of reasons that may not even involve academics, and you can plainly see that this proposal serves only to neuter opportunity. Disadvantaged families would be hardest hit, as a policy shift like this would effectively trap many of them in schools they are actively trying to escape. Does that sound like progress to you?

Forcing draconian accountability measures onto private providers is both unnecessary and counterproductive. CAP argues that “If private school voucher programs are to receive public support, then the participating private schools should be on level footing with public schools.” It fails to mention, however, that choice programs categorically do not put private schools on equal footing with public schools.

Most programs cap scholarship values at an amounts significantly lower than state per-pupil funding—a design decision that has generated billions of dollars in savings for state governments across the country. Similarly, scholarship students typically make up only a percentage of students in any given private schools. If a school serves only a relative handful of scholarship students and receives only a tiny fraction of resources given to the public system, does it make sense to place it on “level footing” with the public system in terms of regulatory burden?

More importantly, rigid accountability and excessive regulation can have the counterintuitive effect of decreasing the quality of available private options. You can read in detail about this phenomenon here, but here are the CliffsNotes: Heavy regulation often leads high-quality, financially stable providers to decline participation in scholarship programs. Less stable providers, on the other hand, are often more than willing to swallow some extra rules for an infusion of scholarship cash. That’s not exactly a recipe for quality.

There’s a lot more to address in the CAP report, but that will have to wait. For now, I’ll leave you with this advice: Considering what just happened in Florida, lawmakers would be wise to stay away from underhanded attempts to cripple support for disadvantaged families. Instead, they should focus on real solutions designed to help more children achieve their dreams. And hey, if they need a road map of how to truly improve scholarship programs in their states, they could always start by doing exactly the opposite of what the CAP brief suggests.


U.S. Census Bureau Releases the Opportunity Atlas

The U.S. Census Bureau isn’t exactly known for providing data in an attractive, easy-to-understand format. You can imagine the surprise, then, when the federal agency released its slick new Opportunity Atlas this morning.

The Atlas tracks 20 million Americans from childhood to the present (when those same people are in their mid-30s), then offers a visual depiction of how outcomes differ across geographic areas. Notably, this map is not showing you what is currently happening in a given area. It is showing you what happened to those who began their lives there so many years ago. You are essentially looking at the origin stories of 20 million Americans. The resulting picture is profound.

In a statement, Census Bureau Deputy Director Ron Jarmin said, “The Atlas has great social significance because no one has ever had access to social mobility estimates at such a granular level.” That assessment certainly seems to be true. The Census Bureau has long provided a plethora of data points on counties, cities, and states, but it has never released anything as geographically detailed as this tool.

Zooming in on a city provides a color-coded view of individual neighborhoods. The various colors indicate what happened to the children who grew up there decades ago. You filter by income levels, incarceration rates, high school and college graduation rates, and a variety of other statistics, all of which can be disaggregated by various demographic variables. It’s both fascinating and sobering to see the outcomes of so many lives reflected this way—and to see the enormous differences in life outcomes between children raised just a stone’s throw apart.

The visual representation of disparities in opportunity would be powerful enough on its own, but the Census Bureau has also adopted the uncharacteristic approach of taking a more active position and calling for change.

A formal study released alongside the tool explicitly states that “Policymakers can use these data to better target programs that aim to improve economic opportunities for disadvantaged children by pinpointing the areas within cities that currently have the weakest outcomes.” And the tutorial for the tool itself says, “ZIP code isn’t destiny, but too often it has limited children from reaching their full potential. By understanding how opportunity varies within and across communities, these new data can help identify solutions to improve outcomes for all children.”

There may be some who don’t agree with the Census Bureau’s more active stance on social mobility, but it is difficult to look at the disparities between neighborhoods and not draw the conclusion that something must be done.

While the agency stops short of calling for any specific policy solution, we at ACE know that one of the key ways to equalize opportunity is to expand access to a high-quality education. This new tool is an excellent reminder that much work remains to be done.